myBlog
Tidymodels notes
Notes on tidymodels
Predicting coffee cupping scores
Revisiting the coffee dataset
Learn Git
Git - what every one working with data science should know
Efficient coding
Efficiency is getting more output for less work input
Summary for Python Codes
Compilation of notes for coding with python

Chocolate Ratings
Dark Chocolate ratings dataset from TidyTuesday
2022: A new beginning
Goals for 2022
/Linear-regression---Chap-6-of-Applied-Predictive-Modelling_files/figure-html5/unnamed-chunk-3-1.png)
Applied predictive modelling book - Chap 6: Linear regression
Tidymodels workflow

Support Vector Machine with Palmer Penguins
Tidymodels workflow

Bias-Variance Tradeoff
Notes on preprocessing
Summary for Modelling
Pointers for different ML models
/Impute-missing-data---Captive-Africans_files/figure-html5/unnamed-chunk-6-1.png)
Captive Africans Dataset
Missing data imputation - Following Julia Silge's worked example
AMDIS Annotated Chromatogram
Annnotating GCMS peaks with AMDIS output

Pima Indians Diabetes Dataset
Predicting whether a patient has diabetes

Palmer Penguins
Predicting Sex of Palmer Penguins

Weekly Stock Market Data (ISLR2)
Predicting whether stock moves Up or Down
Text mining from pdf files with Tesseract and pdftools
Optical Character Recognition (OCR) for copying text from pdf files
Retrieving chemical information from the web
Webchem: a very useful package!

Tidy Tuesday Bird Bath Data
Practicing predicting with logistic regression for bird bath observation

The Stock Market Data (ISLR2)
Predicting whether stock moves Up or Down
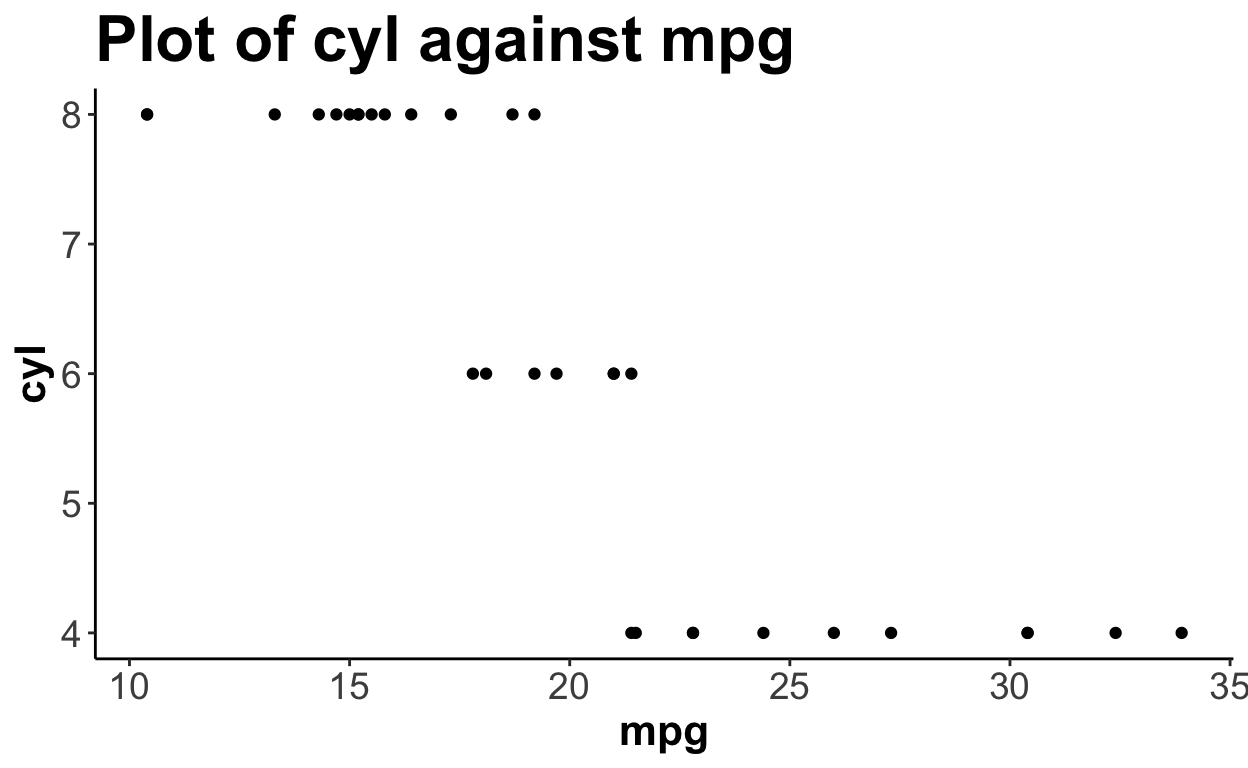
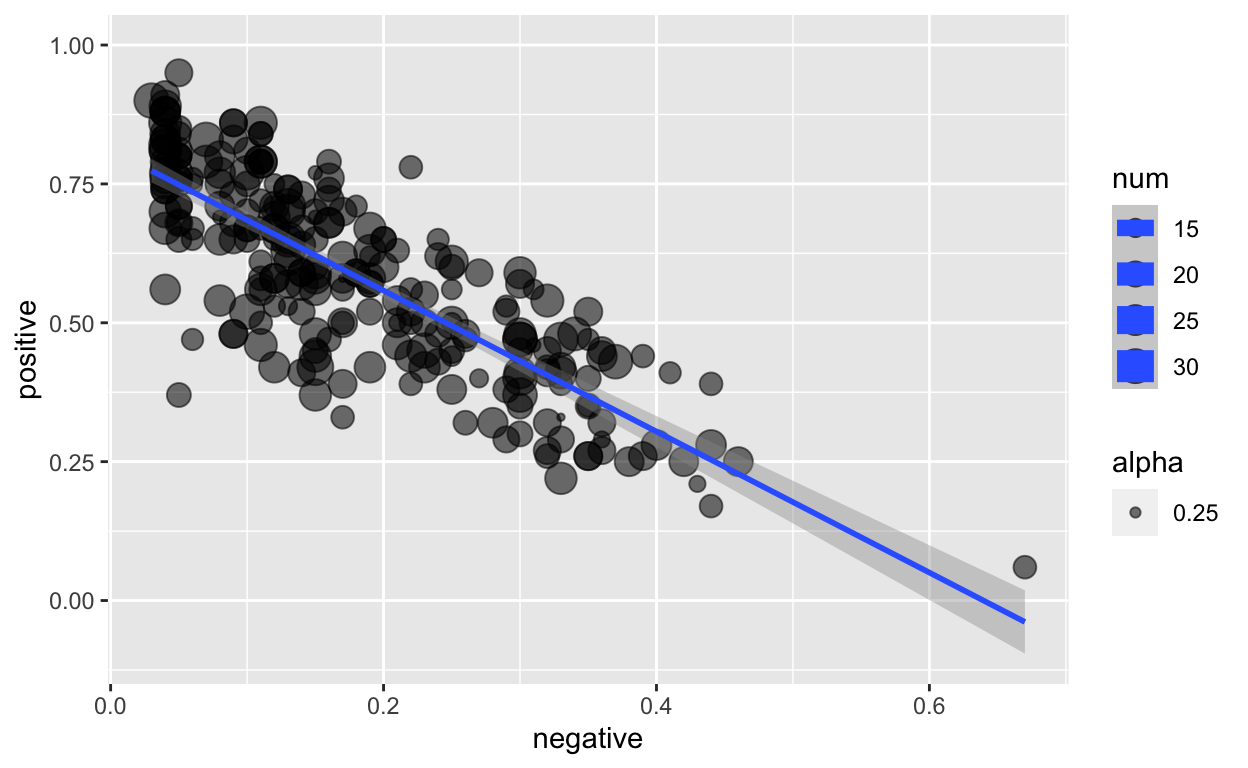
Easy plots with ggplot2
Using curly curly brackets in functions (tidyeval)
Plot a GC-FID Chromatogram
Using ggplot for GCFID chromagram visualization

Annotating GCMS chromatograms
Using ggplot for GCMS chromagrams visualization

Research and Development Expenditure by Area of Research in Singapore
Exporting data out from Singapore Department of Statistics

ISLR03 - Linear Regression
An Introduction to Statistical Learning: With Applications in R, Chapter 2

ISLR02 - Statistical Learning/ Exploratory Data Analysis
An Introduction to Statistical Learning: With Applications in R, Chapter 2
ANOVA to compare sample means
Using ANOVA to compare GI for different noodles

High Dimension Data
EdX Course

Multiple ANOVA in R
What if I have many variables to compare?

Tidy Tuesday Series
20190614 - Ramen Ratings Data

Multiple t-test in R
What if I have many variables to compare?

Tidy Tuesday Series
2018 Week 33 - Malaria Data

Tidy Tuesday Series
2018 Week 32 - US Wind Farm Locations

Tidy Tuesday Series
2018 Week 29 - College Major

Tidy Tuesday Series
2018 Week 30 - Horro Movies
Practice questions
Practice questions for R Studio Exams
Iteration with purrr
R4DS 17 - purrr
Packages I use and books I read
The packages I use often and useful reference books
Vectors
R4DS 16 - Vectors
Cheatsheets
The package to download all cheatsheets
Functions
R4DS 15 - Functions
Date and Time in R
R4DS 13 - Lubridate

Tidy Data
R4DS 09 - Tidy Data with tidyr

Relational Data
R4DS 09 - Relational Data with dplyr

Data Import
R4DS 08 - Data Import with readr

Tibbles
R4DS 07 - Tibbles with tibbles

Exploratory Data Analysis
R4DS 05 - Exploratory Data Analysis

Data transformation
R4DS 03 - Data transformation with dplyr

Design of Experiment - Full Factorial
2ˆk Factorial Design - Another Example
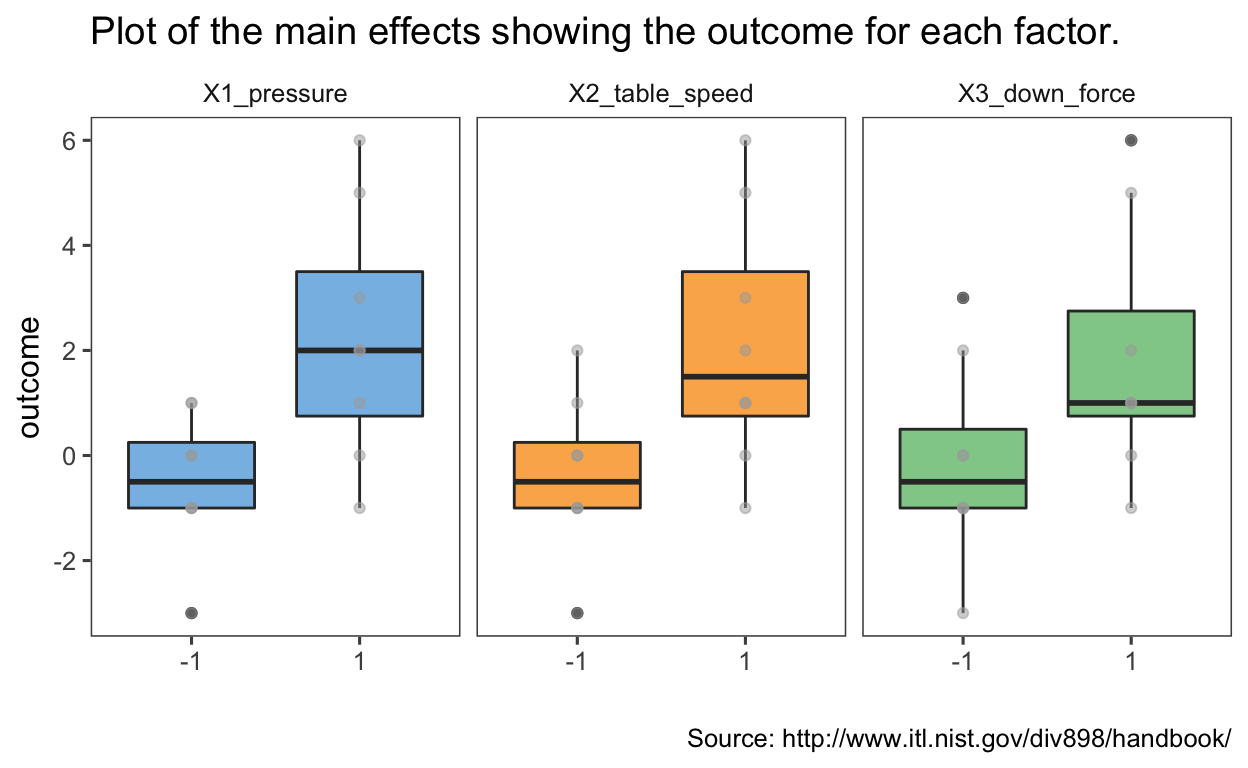
Design of Experiment - Full Factorial
2ˆk Factorial Design - Which factors matter?
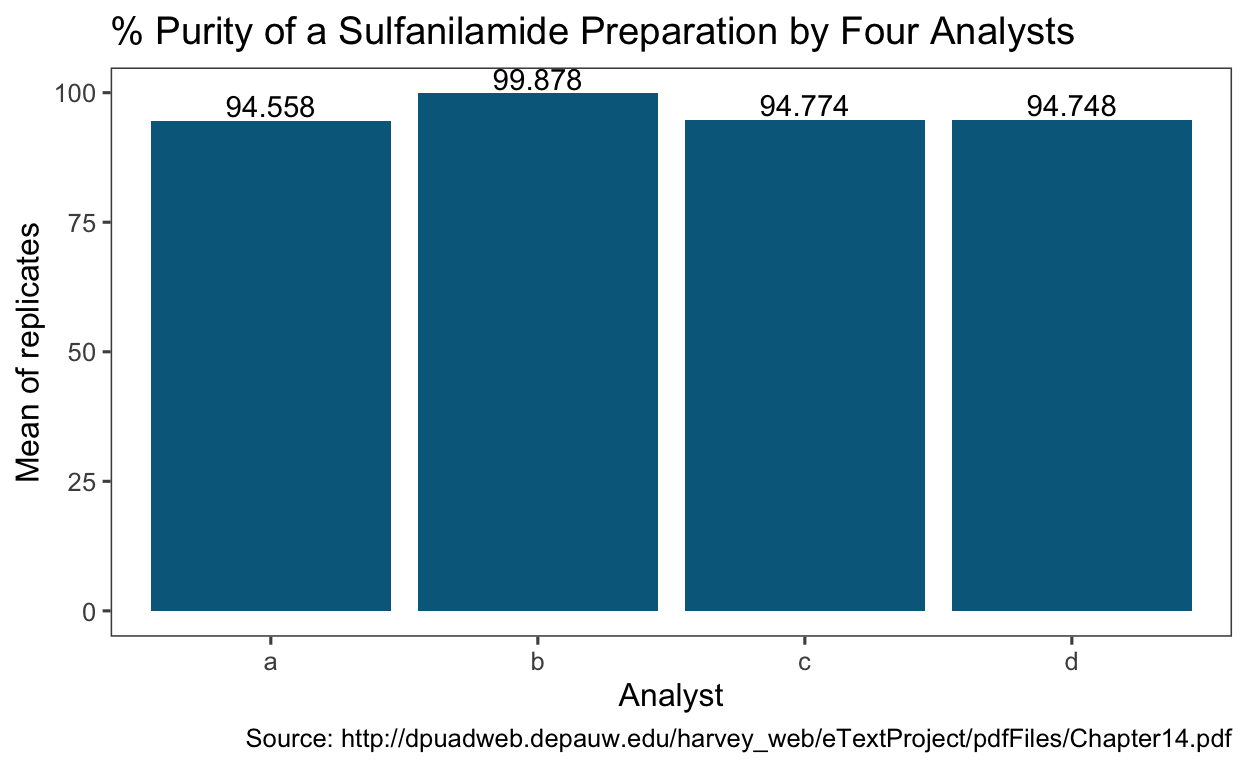
Analytical Chemistry - Comparing Mean, Variance and Detecting Outliers
Using Statistical Tests in Analytical Chemistry
/Meat-NIR-PLS-regression_files/figure-html5/unnamed-chunk-3-1.png)
Meat NIR data
PLS regression on Meat NIR data
Notes - Resampling
Types of resampling techniqes and considerations on which to choose

Tidy Models - Regression
Predicting numerical outcomes using partial least squares on gasoline dataset

Tidy Models - Regression
Predicting numerical outcomes using linear regression and random forest
/Color-analysis-for-Juices_files/figure-html5/unnamed-chunk-11-1.png)
Color Analysis in Juices
Using R for color calculations and data visualization

Comparison of volatiles in Durians
Data visualization for volatiles in different durian varieties
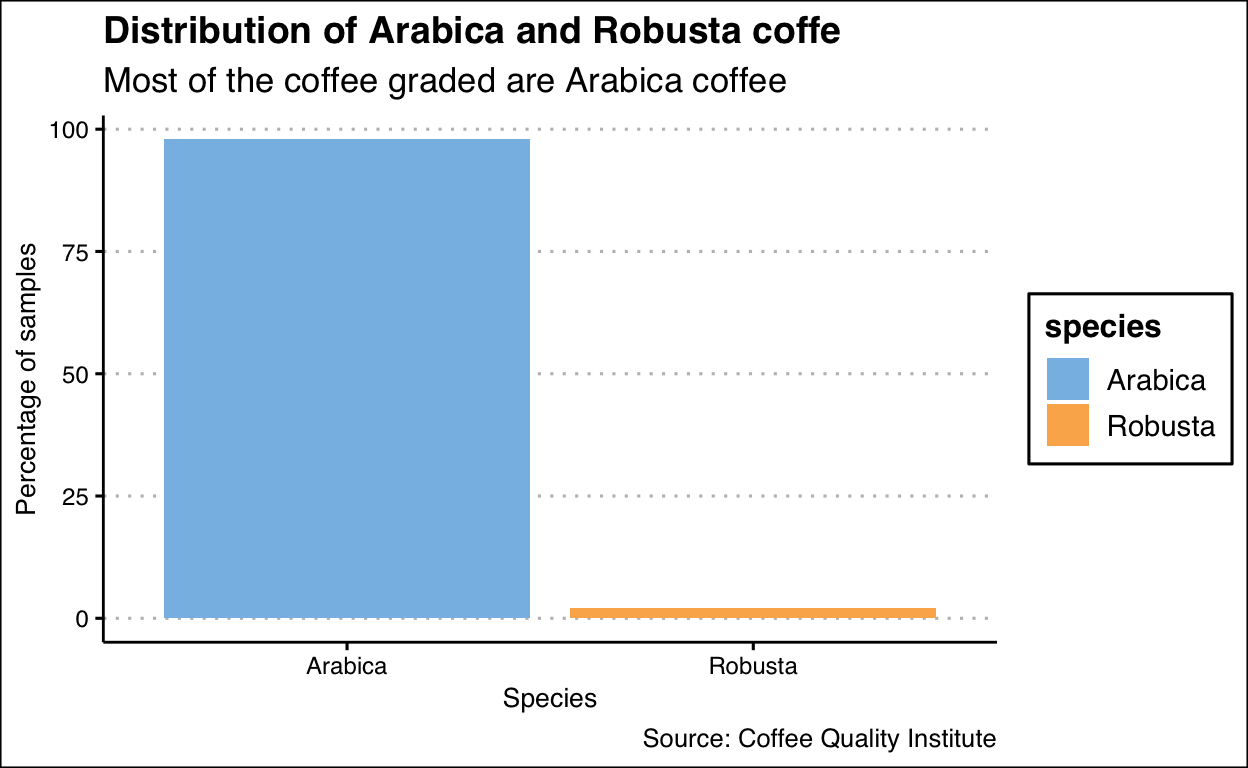
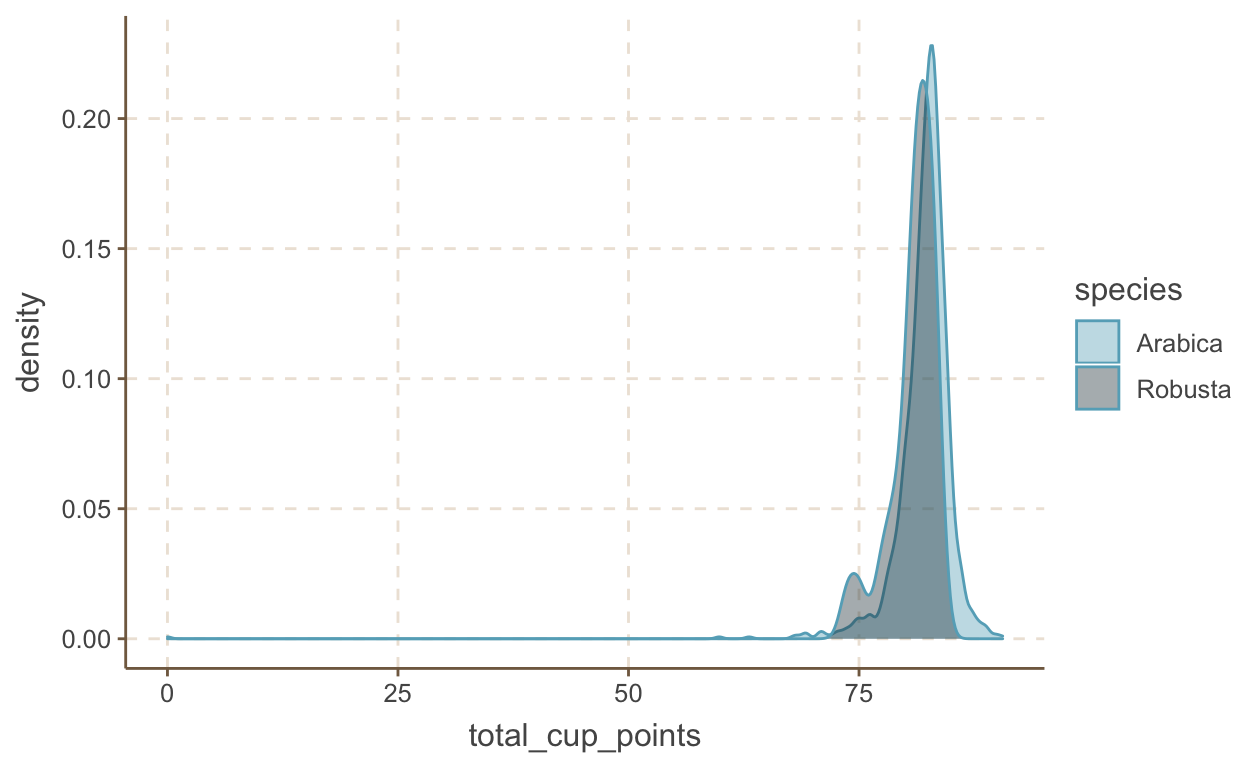
Tidy Tuesday on Coffee Ratings Dataset
Exploratory Data Analysis on Coffee Ratings

Clustering Analysis on Wine Dataset
A continuation from PCA analysis of wine dataset: k-means clustering and hierarchical clustering
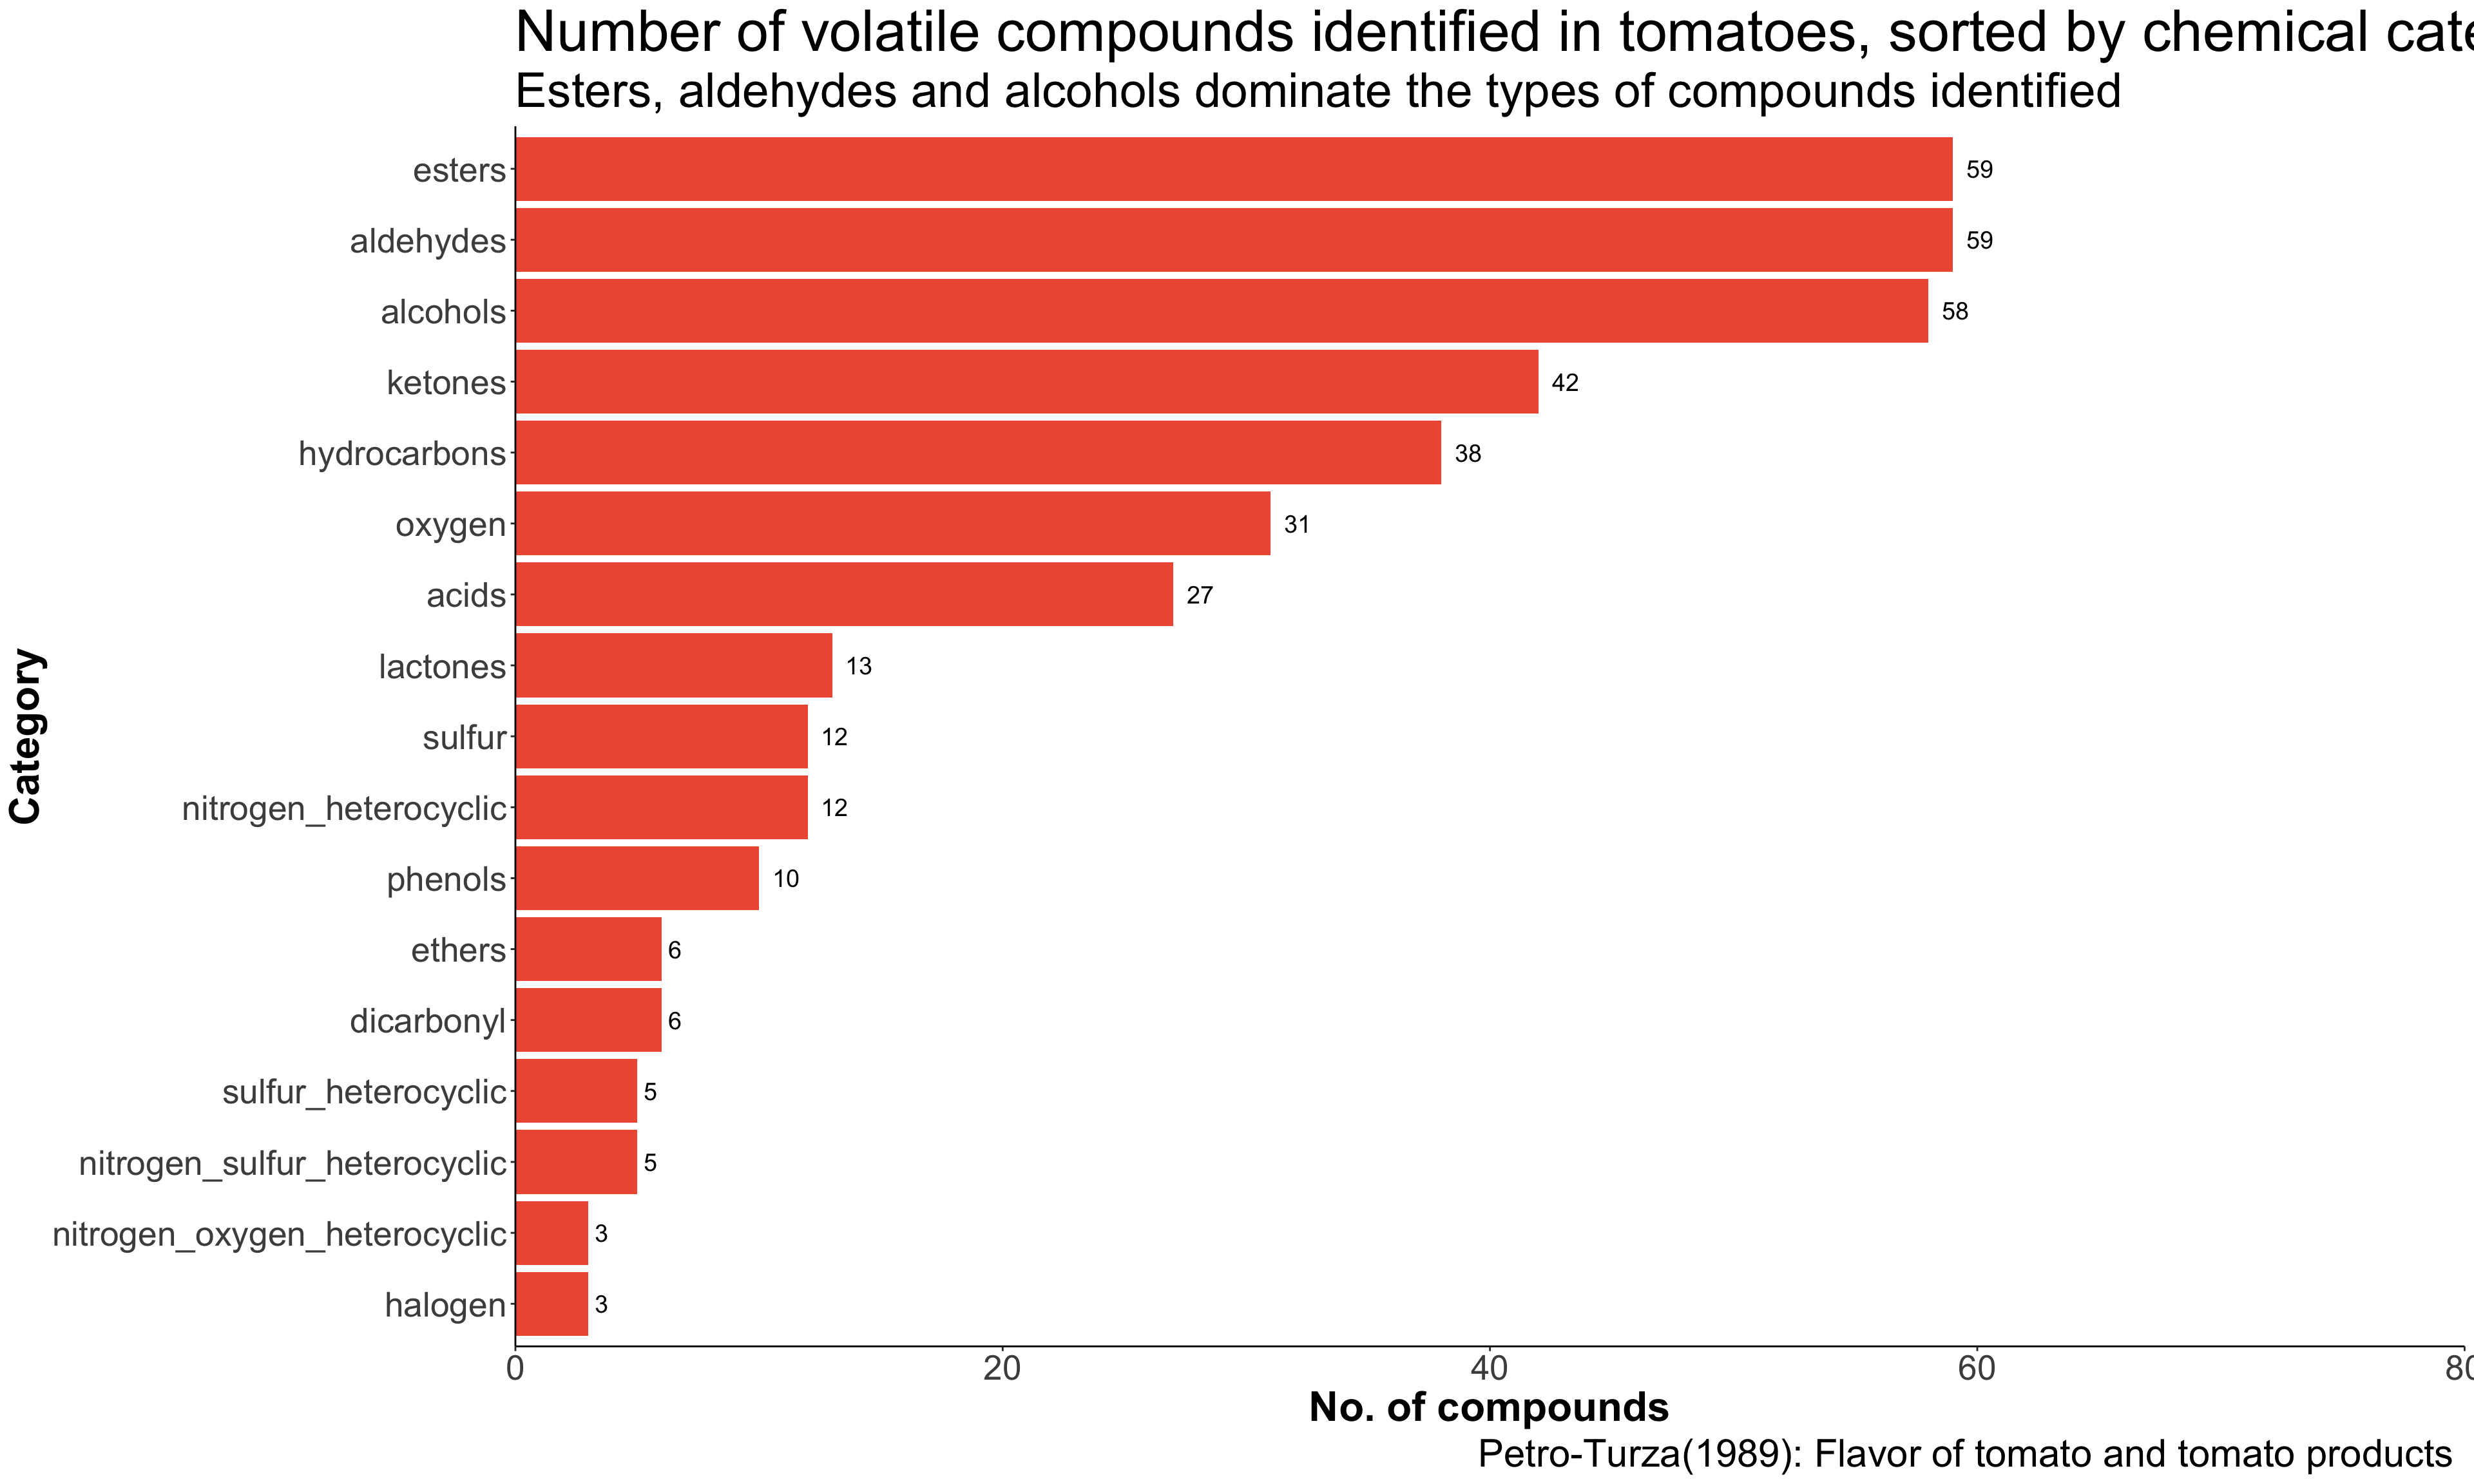
Volatile Compounds in Tomato and Tomato Products
Scraping information from journal article

PCA Wine
PCA (using tidymodels) with wine dataset
Statistical Concepts
Definition of terms
Kovats Index
R script for calculating Kovats Index

Calibration Curves Data
R script for calculating Limit of Detection and Limit of Quantification
Motivations
why R?
My first post: Learning goals for 2021
pRactice corner for coding in R